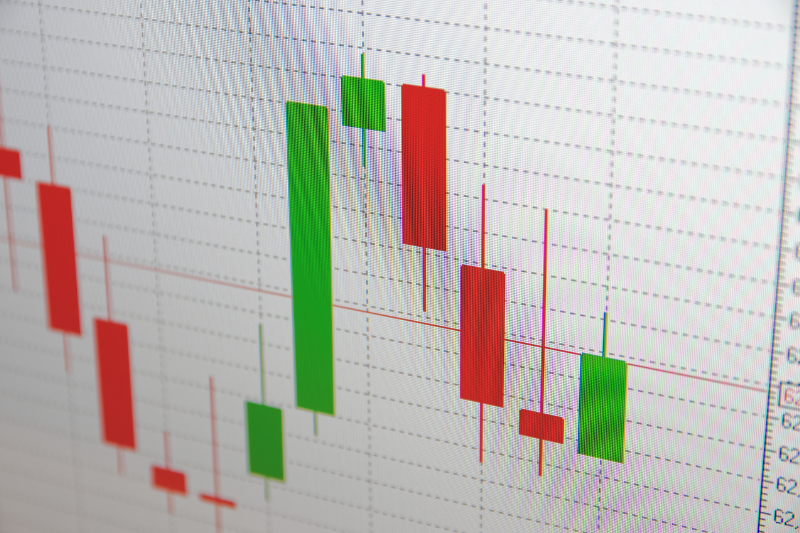
Every candle that is printed on the charts has a meaning. As a trader, it is our responsibility to understand & interpret the meaning to increase the chances of our success. No indicator can tell the actual meaning other than the candlesticks. Before understanding the NO wick concept let’s understand the basic characteristics of any candlestick.

A candlestick can be bearish and bullish and it contains FOUR following components:
- Open Price
- Close Price
- High Price
- Low Price
Bullish Candle with NO Upside Wick in Downtrend
When reading candlesticks; we need to consider two things. First is the volume & second is the market trend. Below is an example of a downtrend in Pre-London Volume time on 1H timeframe. We can clearly see the indicated Green candlestick with no Wick at the top.
In downtrend; if a candle closes bullish with no upside wick. It means that the probability of price to go up is lesser than the probability of price to go down. Wick is basically a range that is left to be filled in preceding candles.
Many traders get in to a position as soon as a candle is printed in their direction. In above example; if a trader has executed buys on 1H bullish candle with NO wick. The chances of next candle to print bullish were lesser. Why? Firstly, we are in downtrend. Secondly, a bullish candle is formed with no wick. If a trader here has referred to the candlestick meaning; he must have avoided the buys and have looked for sell opportunity.

https://www.instagram.com/p/CxpNINzsh-s/
Below is an example of bearish candlestick with No downside wick in an uptrend. Remember we need to consider Volume and trend in mind before understanding the candlesticks. It’s like a puzzle. As a trader; we have to solve the puzzle by putting the right character at the right place.
Bearish Candlestick with NO downside wick in Uptrend
In below example; we are in uptrend and Post London session volume is there. We can see a bearish candlestick is formed on the chart with almost no wick. It clearly is indicating that price is likely to go up on the next candle. As there is no downside range left in the last candle to be fulfilled.

This is just one example of how we have to read the candlesticks and plan our trades accordingly. In coming articles; I will cover more details on how to plan a setup if such candles are printed on the chart.


