How to read a Candlestick with NO top or bottom wick?
Every candle that is printed on the charts has a meaning. As a trader, it is our responsibility to understand & interpret the meaning to

Every candle that is printed on the charts has a meaning. As a trader, it is our responsibility to understand & interpret the meaning to

On Higher Timeframe 1 Week & 1 Month Gold is still in uptrend & showing bullish signs. Below is 1M chart where we can see

After selecting the best trading session; next move is to take 1-2 trades every day. I know it’s a hard call but it is to

After selecting & focusing on 1-2 Trading pairs. Next task of a trader is to identify which trading session is feasible for them to trade.

Previous we put emphasis on DEMO ACCOUNT & RISK MANAGEMENT. In this article; you will learn the importance of focusing on 1-2 trading pairs. New

Almost every new trader lacks trading discipline; which is regarded as the backbone of successful trading journey. Risk management is one of the key part
Get all the important updates on Forex

Every candle that is printed on the charts has a meaning. As a trader, it is our responsibility to understand & interpret the meaning to

On Higher Timeframe 1 Week & 1 Month Gold is still in uptrend & showing bullish signs. Below is 1M chart where we can see

After selecting the best trading session; next move is to take 1-2 trades every day. I know it’s a hard call but it is to

Every candle that is printed on the charts has a meaning. As a trader, it is our responsibility to understand & interpret the meaning to

After selecting the best trading session; next move is to take 1-2 trades every day. I know it’s a hard call but it is to

After selecting & focusing on 1-2 Trading pairs. Next task of a trader is to identify which trading session is feasible for them to trade.

Every candle that is printed on the charts has a meaning. As a trader, it is our responsibility to understand & interpret the meaning to

On Higher Timeframe 1 Week & 1 Month Gold is still in uptrend & showing bullish signs. Below is 1M chart where we can see

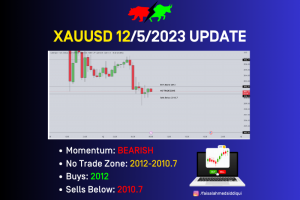
Here we go. This is the last day of a rollarcoaster week. Yesterday #XAUUSD price dumped from 2037 to 2010 that is around 270 pips.

The analysis shared is based on Simple Price Action Analysis where Support, Resistance & clean range is taken underconsideration. Yesterday, after the CPI news price

Copyright © 2023 Escils All Right Reserved
Join our waitlist we will inform you once the offer is available with first birds disscounts!
As per our last update; we have executed “Brand Level” changes; that has impacted the product access process; for all our valued students & vendors.
Registered students can now access their course from following Link:
Course Access Link: https://eskills1.teachable.com
Use same ID and password to access the course.
We regret to inform you that our support operation will be discontinued in 1 Day time period. Notice to access your paid content will also be updated on our Social Media channels as well.
Regards,
Team Escils