Where #XAUUSD Gold Price will move? Sell or BUY find out
On Higher Timeframe 1 Week & 1 Month Gold is still in uptrend & showing bullish signs. Below is 1M chart where we can see that as soon as last month high was taken off; price of #XAUUSD moved significantly to print a new all-time high. Key region on chart is 1977.49 which is the […]
Focus on Taking 1-2 Trades Every Day for Consistent Results

After selecting the best trading session; next move is to take 1-2 trades every day. I know it’s a hard call but it is to be applied for a reason. Traders who take multiple trades every days are not focused. They randomly execute trades. On losing they open a revenge trade & loose further. In […]
Do not risk over 1% of your Trading Capital – Trading Tip
Almost every new trader lacks trading discipline; which is regarded as the backbone of successful trading journey. Risk management is one of the key part of trading. NEVER RISK more than 1% of your trading capital if you are a beginner. What does 1% risk means? Let’s understand it in detail. Suppose you have a […]
#XAUUSD Gold Chart Analysis Friday May 12 2023
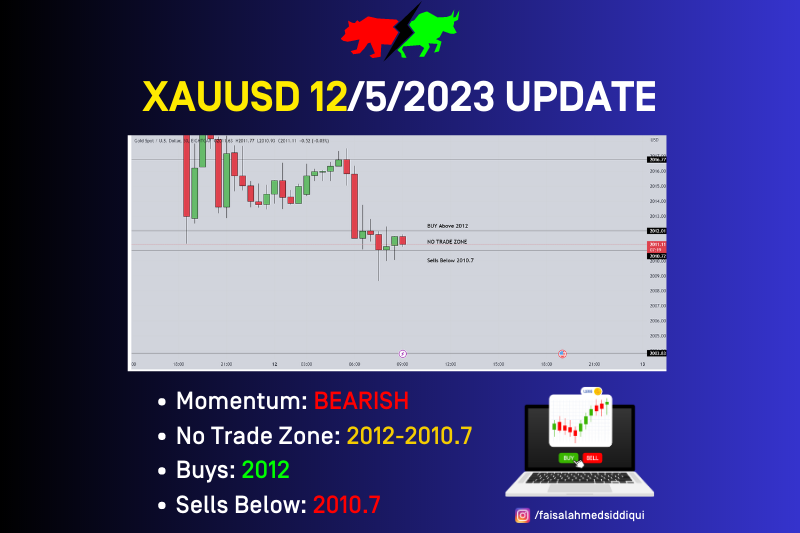
Here we go. This is the last day of a rollarcoaster week. Yesterday #XAUUSD price dumped from 2037 to 2010 that is around 270 pips. Today we can expect volume & volatality in the market due to news and week end. Right now gold is trading around 2012 & 2010.7 NO trade region. The 4 […]
How to avoid spiling your Trading Career?
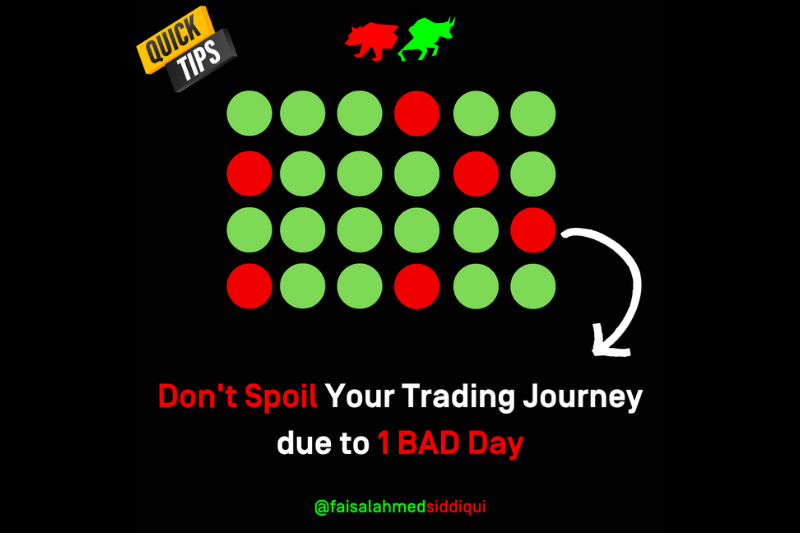
From today onwards; I’ll be posting valuable content related to financial markets. 😎 In coming weeks/months a lot more to come related to financial market education. 🔥 👉 Lets start off with the first valuable tip. 👉 Treat trading as Marathon not a Sprint. Professional traders face both good & bad days. As a good […]
#XAUUSD GOLD Analysis 11 May 2023
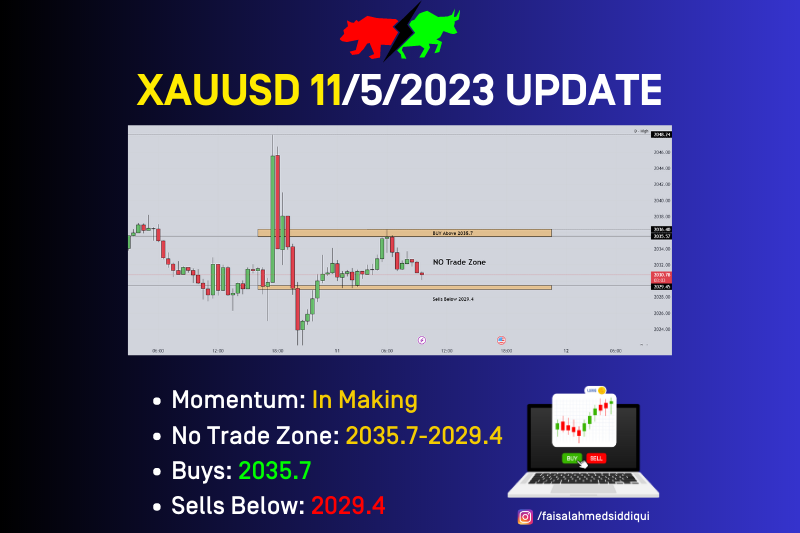
The analysis shared is based on Simple Price Action Analysis where Support, Resistance & clean range is taken underconsideration. Yesterday, after the CPI news price of Gold pumped massively 157 pips in one signle 30 minutes candle. The whole price pump gap was filled in the next two hours candle. Currently follow the following key […]
GOLD #XAUUSD Analysis 9 May 2023
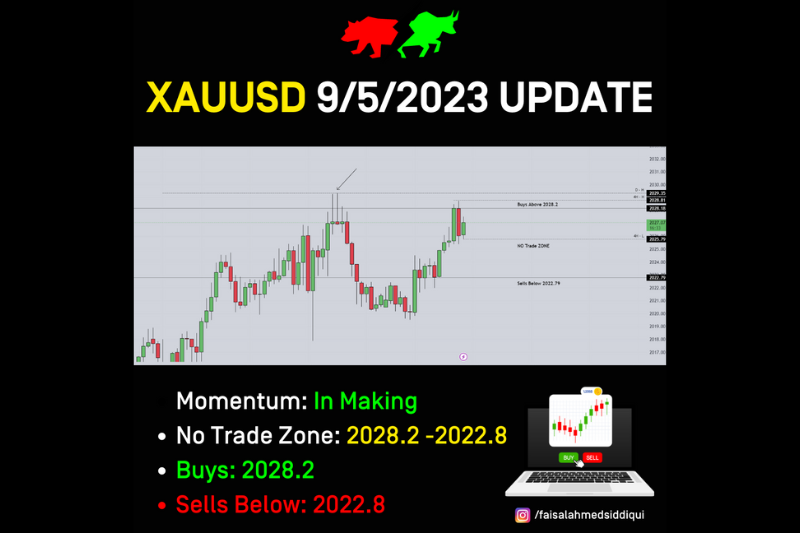
#xauusd update pre London session. Asian session pushed the price up. We have resistance in 2028.18 region. If price closes above that we can look for buys. Sells area is cluttered. Will only look for sells if 30M TF candle closes below 2022.8 region.
Gold #XAUUSD 5 May 2023 Pre London Session Update
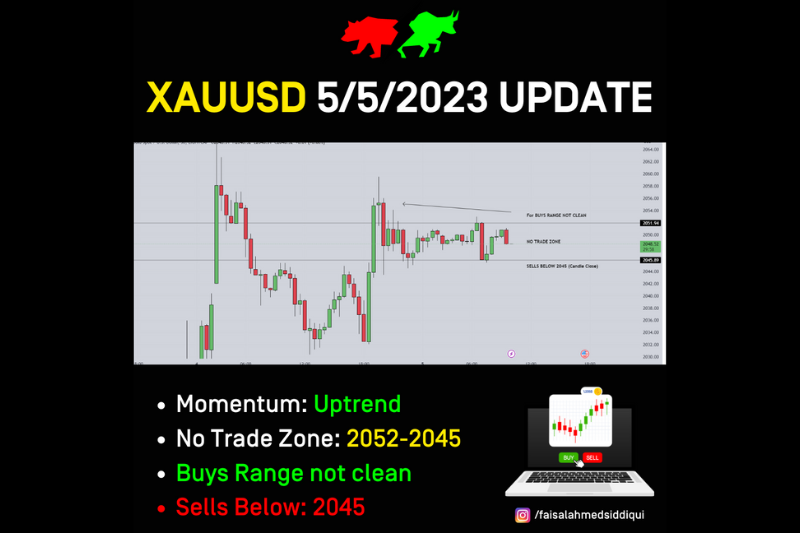
#XAUUSD Pre-London Update 5-5-2023 Price still is uptrend & made an ATH yesterday. Price retraced & retested 2060 region. Expecting price to move downside if cancle closes below 2045. Price range for BUYS is not clean will avoid looking for buys. NFP news after 7 hours is lined up. This will decide the Gold faith.
Gold #XAUUSD Analysis 4 May 2023

The analysis is a Pre-London session analysis for XAUUSD gold traders. Overall gold chart on higher timeframe is extremely bullish. We can expect retracement if price of Gold on 30M closes below 2040 region. Buys can be considered if price closed above 2044.3. SELL Update during London session Price closed below 2040 with volume. We […]