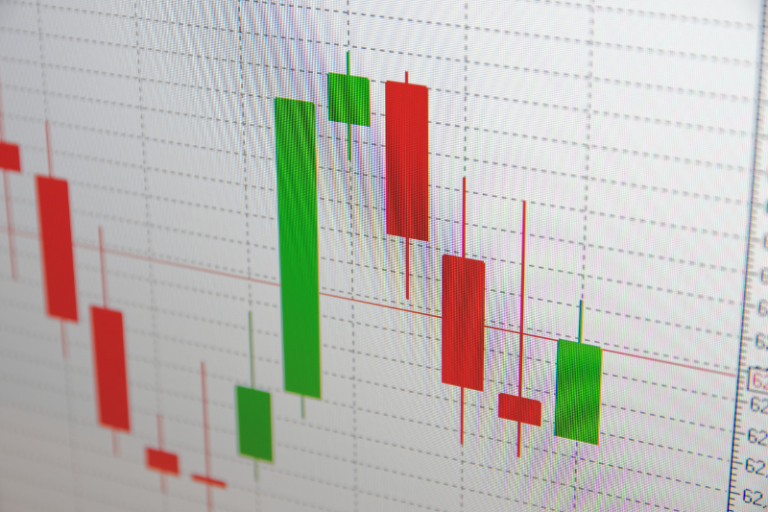
How to read a Candlestick with NO top or bottom wick?
Every candle that is printed on the charts has a meaning. As a trader, it is our responsibility to understand & interpret the meaning to

Every candle that is printed on the charts has a meaning. As a trader, it is our responsibility to understand & interpret the meaning to

On Higher Timeframe 1 Week & 1 Month Gold is still in uptrend & showing bullish signs. Below is 1M chart where we can see
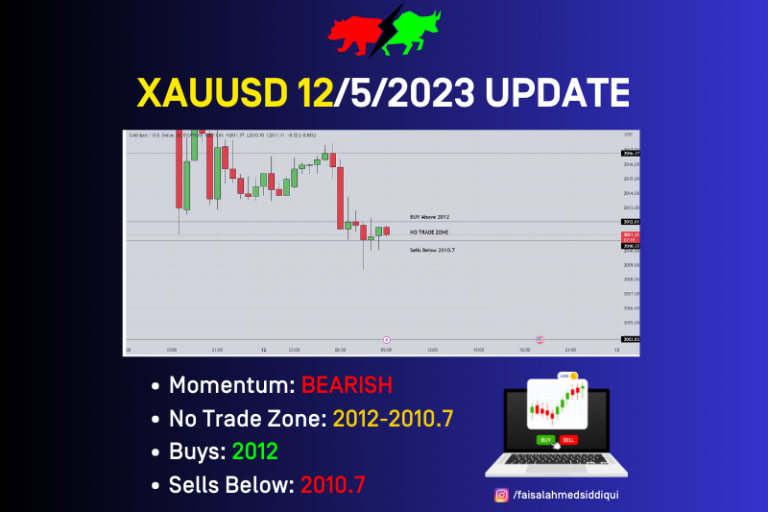
Here we go. This is the last day of a rollarcoaster week. Yesterday #XAUUSD price dumped from 2037 to 2010 that is around 270 pips.
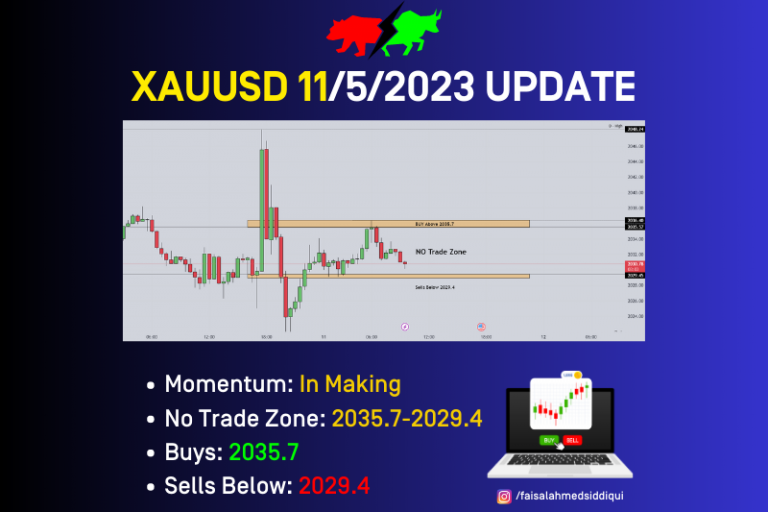
The analysis shared is based on Simple Price Action Analysis where Support, Resistance & clean range is taken underconsideration. Yesterday, after the CPI news price
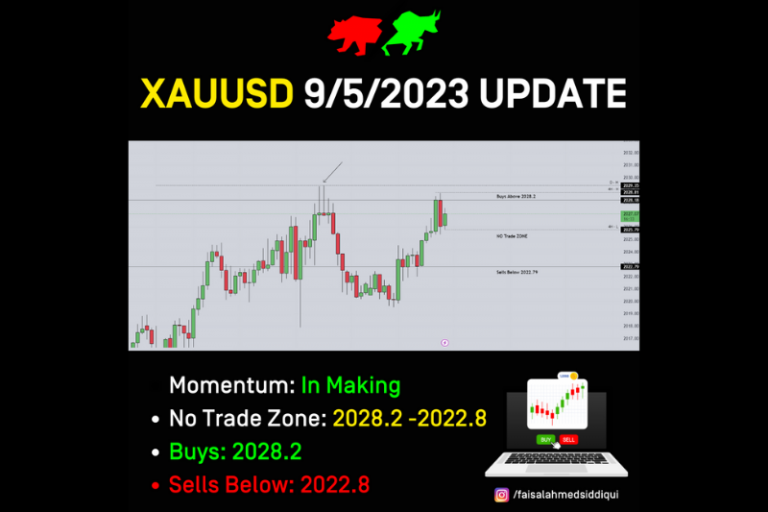
#xauusd update pre London session. Asian session pushed the price up. We have resistance in 2028.18 region. If price closes above that we can look for
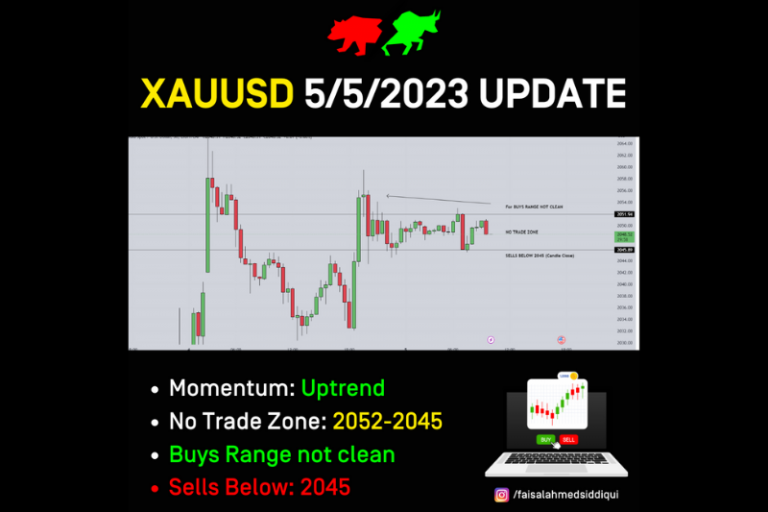
#XAUUSD Pre-London Update 5-5-2023 Price still is uptrend & made an ATH yesterday. Price retraced & retested 2060 region. Expecting price to move downside if cancle
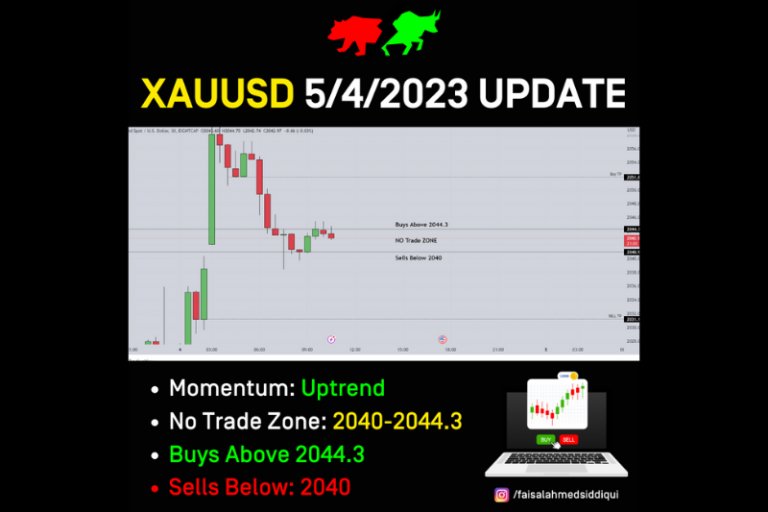
The analysis is a Pre-London session analysis for XAUUSD gold traders. Overall gold chart on higher timeframe is extremely bullish. We can expect retracement if
Copyright © 2023 Escils All Right Reserved